Makindo Medical Notes.com |
|
|---|---|
| Download all this content in the Apps now Android App and Apple iPhone/Pad App | |
| MEDICAL DISCLAIMER:The contents are under continuing development and improvements and despite all efforts may contain errors of omission or fact. This is not to be used for the assessment, diagnosis or management of patients. It should not be regarded as medical advice by healthcare workers or laypeople. It is for educational purposes only. Please adhere to your local protocols. Use the BNF for drug information. If you are unwell please seek urgent healthcare advice. If you do not accept this then please do not use the website. Makindo Ltd | |
ECG Analysis
-
| About | Anaesthetics and Critical Care | Anatomy | Biochemistry | Cardiology | Clinical Cases | CompSci | Crib | Dermatology | Differentials | Drugs | ENT | Electrocardiogram | Embryology | Emergency Medicine | Endocrinology | Ethics | Foundation Doctors | Gastroenterology | General Information | General Practice | Genetics | Geriatric Medicine | Guidelines | Haematology | Hepatology | Immunology | Infectious Diseases | Infographic | Investigations | Lists | Microbiology | Miscellaneous | Nephrology | Neuroanatomy | Neurology | Nutrition | OSCE | Obstetrics Gynaecology | Oncology | Ophthalmology | Oral Medicine and Dentistry | Paediatrics | Palliative | Pathology | Pharmacology | Physiology | Procedures | Psychiatry | Radiology | Respiratory | Resuscitation | Rheumatology | Statistics and Research | Stroke | Surgery | Toxicology | Trauma and Orthopaedics | Twitter | Urology
Related Subjects: |ECG Basics |ECG Axis |ECG Analysis |ECG LAD |ECG RAD |ECG Low voltage |ECG Pathological Q waves |ECG ST/T wave changes |ECG LBBB |ECG RBBB |ECG short PR |ECG Heart Block |ECG Asystole and P wave asystole |ECG QRS complex |ECG ST segment |ECG: QT interval |ECG: LVH |ECG RVH |ECG: Bundle branch blocks |ECG Dominant R wave in V1 |ECG Acute Coronary Syndrome |ECG Narrow complex tachycardia |ECG Ventricular fibrillation |ECG Regular Broad complex tachycardia |ECG Crib sheets
Tutorial from Queens University Toronto
Introduction: see credits below
- The electrocardiogram (ECG) is one of the most useful diagnostic tests in emergency medicine. It is an easy and inexpensive test that is used routinely in the assessment of patients with chest pain.
- The ECG is the cornerstone for making the diagnosis of cardiac ischaemia and is used for making decisions about eligibility for thrombolytic therapy.
- To avoid misinterpreting the ECG, the clinician must have a systematic approach. This module is designed to guide the learner through a stepwise approach to ECG interpretation.
- Specific examples of a variety of abnormal ECG's are included at the end along with a brief quiz.
Objectives
- By the end of this learning module you should have a systematic approach to interpreting the ECG and be able to identify common ECG abnormalities.
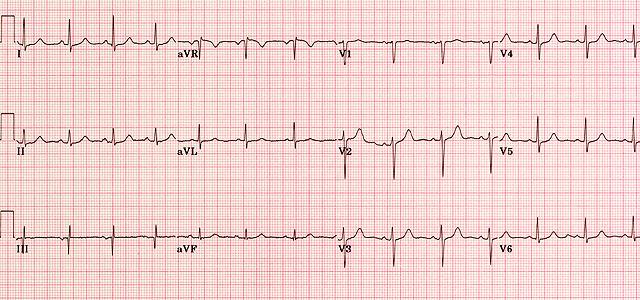
The 12 lead ECG
- The 12 lead ECG is made up of the three standard limb leads (I, II and III), the augmented limb leads (aVR, aVL and aVF) and the six precordial leads (V1, V2, V3, V4, V5 and V6)
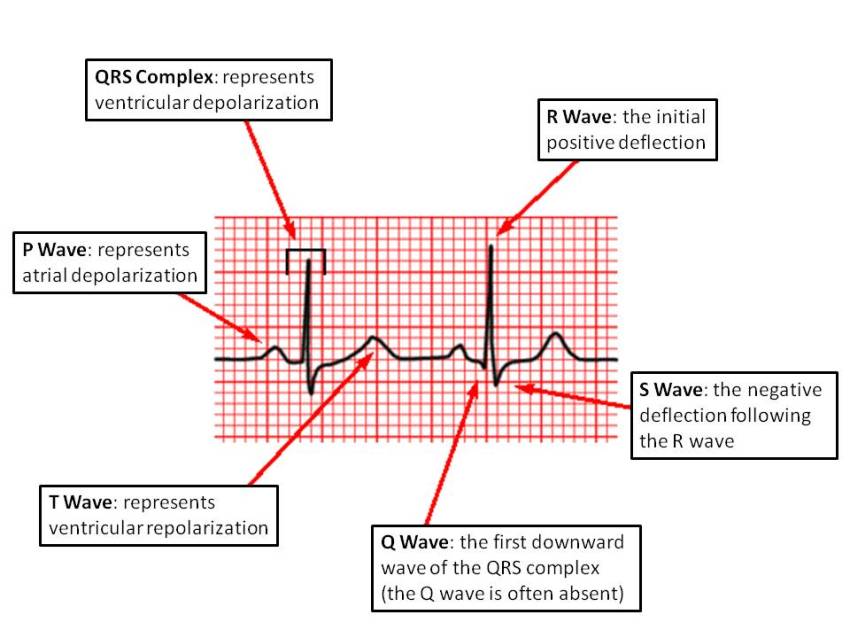
Waves and complexes
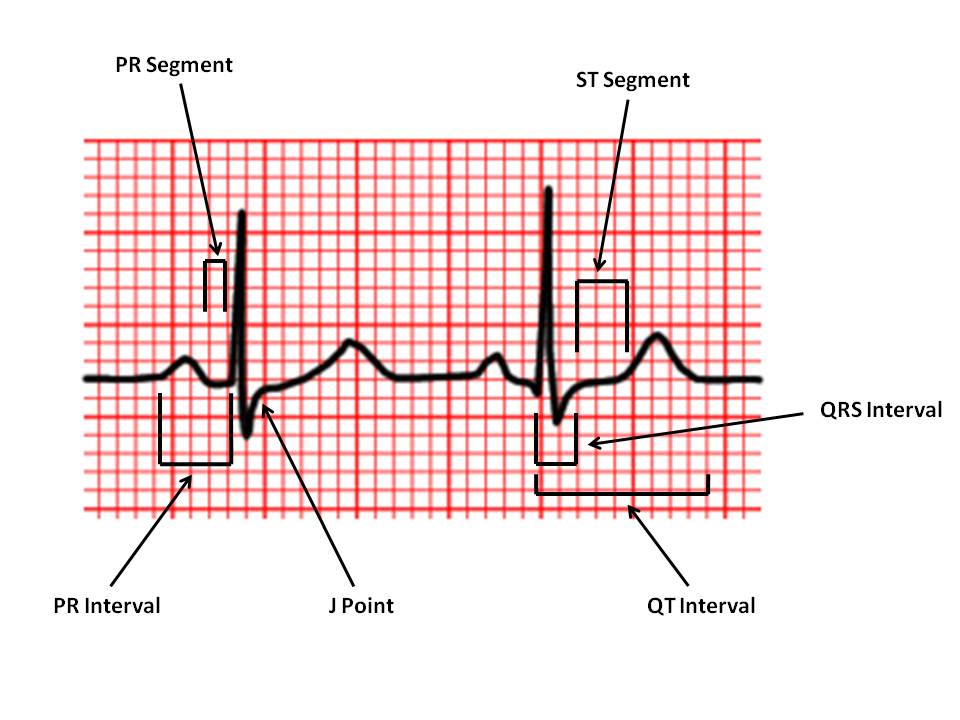
Intervals and segments>
| PR Interval: |
From the start of the P wave to the start of the QRS complex |
| PR Segment: |
From the end of the P wave to the start of the QRS complex |
| J Point: |
The junction between the QRS complex and the ST segment |
| QT Interval: | From the start of the QRS complex to the end of the T wave |
| QRS Interval: | From the start to the end of the QRS complex |
| ST Segment: | From the end of the QRS complex (J point) to the start of the T wave |
Normal Values
| Heart rate | 60 - 100 bpm |
||
| PR interval | 0.12 - 0.20 s |
||
| QRS interval | = 0.12 s |
||
| QT interval | < half RR interval (males < 0.40 s; females < 0.44 s) |
||
| P wave amplitude (in lead II) | = 3 mV (mm) |
||
| P wave terminal negative deflection (in lead V1) | = 1 mV (mm) |
||
| Q wave | < 0.04 s (1 mm) and < 1/3 of R wave amplitude in the same lead |
Approach to the ECG
Developing a systematic approach to the interpretation of the ECG is a critical skill for all clinicians. The following outlines one such approach.Step 1
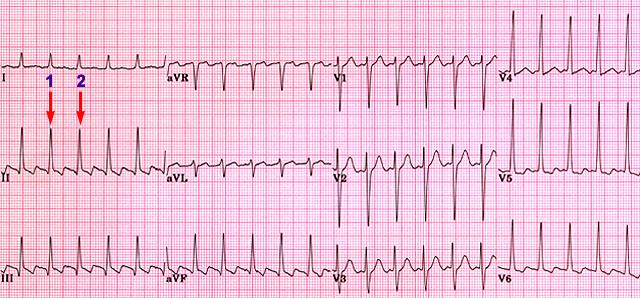
There are a number of strategies for determining the heart rate. A simple, quick technique is to find a QRS complex that falls on a major vertical grid-line (1), then count the number of large squares to the next QRS complex (2). Dividing this number into 300 gives you the heart rate. In the ECG below, there are 2 large squares between QRS complexes. 300/2 gives a heart rate of 150 beats per minute.
Step 2: Measure important intervals
The measurement of important electrocardiographic intervals usually includes the PR interval, the QRS interval and the QT interval. At a standard paper speed of 25 mm/second, the width of each small square (1mm) represents 0.04 seconds. One large square (5mm) represents 0.2 seconds.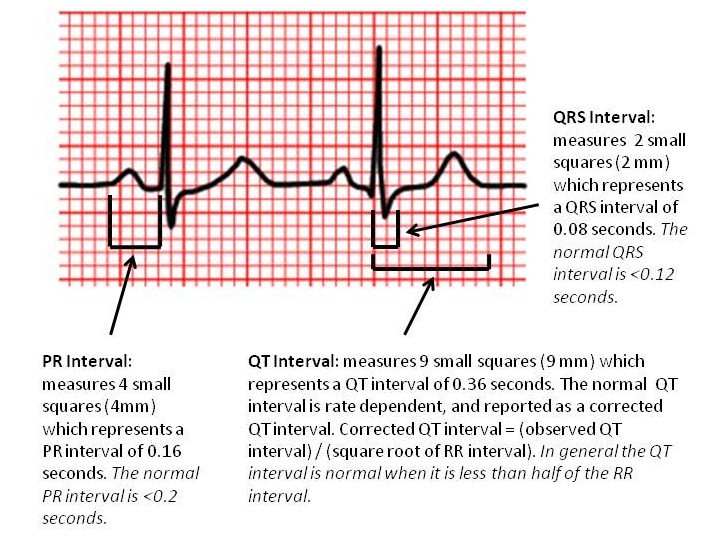
Evaluate the Rhythm
If the rhythm is regular, the RR interval should be constant throughout the ECG. This can be checked using calipers, or more simply by marking on a piece of paper the distance between two R waves, and comparing this distance between pairs of QRS complexes on the ECG. Next, check to see if a P wave is present before each of the QRS complexes.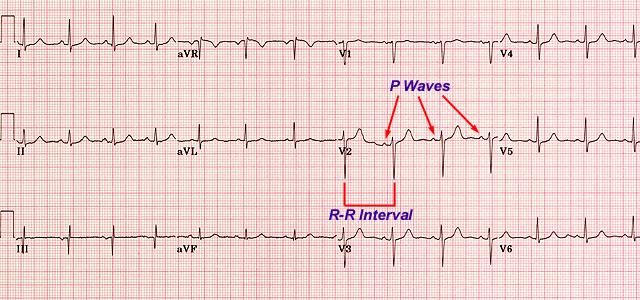
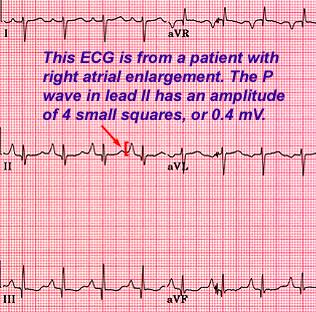
Inspect P waves for atrial enlargement
The P waves in leads I, II, III and V1 should be inspected for evidence of right or left atrial enlargement. Usually, lead II will have the clearest P wave.- P wave amplitude should not exceed 3 small squares (3 mm or 0.3mV). If it does, this represents right atrial enlargement.
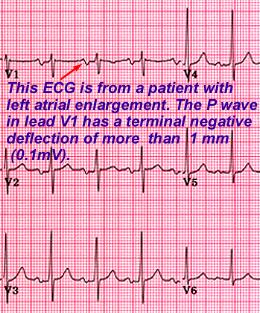
- In lead V1, the terminal negative deflection of the P wave represents left atrial depolarization and should not exceed 1 mm (0.1mV). If it does, this is indicative of left atrial enlargement.
 |
 |
Inspect QRS complexes for ventricular hypertrophy or low voltage
| In the setting of Left Ventricular Hypertrophy (LVH), the left ventricle enlarges and so the leads oriented to the left ventricle (V5, V6, aVL) will "see" more electrical activity moving towards them. As well, the leads oriented away from the left ventricle (V1, V2) will "see" more activity moving away from them. In LVH therefore, leads V5, V6 and aVL will have tall R waves, while leads V1 and V2 will have deep S waves. (The arrow in the diagram on the right shows the direction of the net electrical activity in LVH.) | 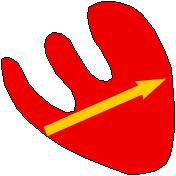 |
|
|
V1 or V2
|
V5, V6 or aVL
|
The voltage criteria for LVH are satisfied if the sum of the amplitude of the deepest S wave in V1 or V2, and the amplitude of the tallest R wave in V5 or V6, is equal to or greater than 35 mm (3.5 mV). The voltage criteria are also satisfied if the amplitude of the R wave in lead aVL is equal to or greater than 12 mm (1.2mV). |
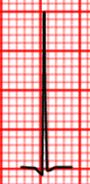
Assess Q waves and determine significance
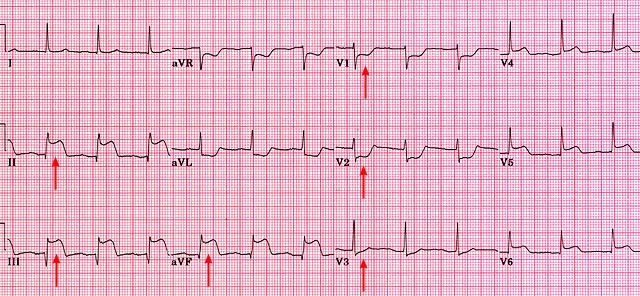
The Q waves should be assessed and their significance determined, particularly in regard to the diagnosis of myocardial infarction. Small Q waves are commonly a normal finding in the inferior leads III and aVF, and in the anterolateral leads aVL, I, V5 and V6. Q waves of 0.04 seconds (1 mm) duration and greater than one third the R wave's amplitude in the same lead may be pathological.
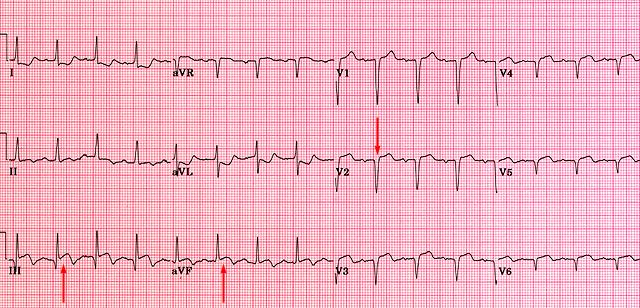
The pathological Q waves are seen in V1 - V6 indicate that this patient has had an anterior MI in the past. This patient also has evidence of an acute inferior MI as shown by the ST-segment elevation in leads III and aVF.
Assess ST segments and T waves
Assess the ST segment for the presence of elevations or depressions, together with T wave abnormalities. ST elevation can indicate the presence of conditions such as acute myocardial injury, Prinzmetal's (variant) angina, pericarditis, ventricular aneurysm or myocardial ischaemia.
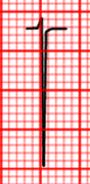
Measure QT interval for specific diagnoses
The QT interval can be prolonged secondary to metabolic disorders and drug effects. It must be corrected for heart rate since it is rate dependent. The corrected QT interval is calculated using the following formula:- QTI corrected = (QTI observed) / (square root of RR interval)
The QTI corrected is often reported with computerized ECG interpretation.
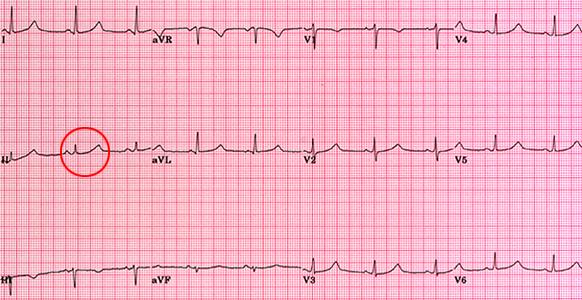
This ECG is from a male patient with familial prolonged QT syndrome. The QTI corrected is approximately 0.52 seconds. Normal QTI corrected: 0.40 seconds for males; 0.44 seconds for females.